Adoption in the US Statistics Guide: Insights for 2026
Adoption in the US is evolving rapidly, and the landscape is changing in ways few expected. If you are searching for adoption in the us statistics, you are in the right place. This guide gives you the latest insights to help you navigate new trends, challenges, and opportunities emerging in 2026.
Inside, you will find the most current data, from types of adoption and demographic shifts to state-by-state differences and future projections. Whether you are a prospective parent, policymaker, or advocate, this resource empowers you to make informed, confident decisions in a fast-changing world.
Overview of Adoption in the US: Key Figures and Definitions
Understanding adoption in the US starts with clear definitions and a look at the numbers shaping the landscape. With varied types, processes, and family profiles, adoption in the us statistics reveal much about how American families are built today.

What is Adoption? Types and Terminology
Adoption is a legal process that transfers parental rights and responsibilities from a child's birth parents to adoptive parents. There are several types in the US: domestic (within the US), international (from other countries), foster care (children in the state system), and kinship adoption (by relatives).
Open adoptions allow for some contact between birth and adoptive families, while closed adoptions keep identities private. Step-parent and relative adoptions are also common, each with unique legal steps. For example, agency adoptions involve licensed organizations, while private adoptions happen directly between families and attorneys.
Clarity in these terms is crucial when interpreting adoption in the us statistics and making informed choices.
National Adoption Statistics: Current Landscape
As of 2024, approximately 115,000 adoptions occur annually in the US, with the majority being domestic or from foster care. About 54 percent are foster care adoptions, international adoptions have declined sharply, and private domestic adoptions remain steady.
Age distribution shows that most adopted children are under age 10, but the median age is gradually rising. Recent years saw a drop in international placements and a boost in foster care adoptions. For a deeper dive, see this Adoption statistics overview, which breaks down trends by type and year.
These shifts in adoption in the us statistics highlight changing needs and opportunities for families.
Demographics of Adoptive Families and Children
Adoptive families reflect a wide range of racial, ethnic, and economic backgrounds. Around 28 percent of adopted children are of a different race than their adoptive parents. Families include single parents, same-sex couples, and traditional two-parent households.
Children adopted in the US are nearly evenly split between boys and girls, with an increasing number of older children and siblings being placed together. LGBTQ+ parents are represented in a growing share of new adoptions, reflecting broader acceptance and legal changes.
These demographic trends are key to understanding adoption in the us statistics and the challenges faced by diverse families.
Adoption Process Overview
The US adoption process typically involves several steps: application, home study, matching with a child, placement, and finalization in court. Timeframes vary by type—domestic infant adoptions may take 1 to 2 years, while foster care placements can be quicker.
Costs range widely: domestic infant adoptions average $25,000 to $50,000, foster care adoptions are often low-cost or subsidized, and international adoptions can exceed $40,000. Every adoption requires a home study and legal clearances.
Prospective parents should study adoption in the us statistics to set expectations and prepare for the journey.
Trends Shaping US Adoption: 2021–2026
The landscape of adoption in the us statistics is changing rapidly as we approach 2026. Shifts in laws, social attitudes, and global events are creating new realities for families, children, and professionals. To make informed decisions, it’s critical to understand the trends shaping adoption in the us statistics today.

Decline in International Adoptions
One of the most significant trends in adoption in the us statistics is the sharp drop in international adoptions. Stricter regulations, changing international relations, and the Hague Convention have all contributed. For example, from over 4,000 international adoptions in 2010, the number fell below 2,000 in 2023. Countries like China and Ethiopia have tightened or suspended programs. For more about these changes, see International adoptions decline sharply. This decline has shifted the overall adoption in the us statistics landscape, pushing more families to consider domestic options.
Rise in Foster Care Adoptions
At the same time, adoption in the us statistics reveal a growing share of children finding families through foster care. Since 2020, foster-to-adopt placements have risen, now making up 54% of all US adoptions. State and federal incentives, such as those from the Adoption and Safe Families Act (ASFA), encourage families to adopt from foster care. These programs provide support, training, and sometimes financial assistance. As a result, adoption in the us statistics show foster care adoptions are now central to the American adoption experience.
Shifting Age and Needs Profiles
Adoption in the us statistics also show a shift in the age and needs of children being adopted. There’s a notable increase in the adoption of older children, siblings, and those with special needs. The median age of adopted children is rising, with 42% of foster adoptions now involving kids aged six or older. This trend highlights the growing need for families prepared to meet more complex emotional and developmental requirements. Adoption in the us statistics are evolving, reflecting the diversity of children seeking permanent homes.
Open Adoption and Post-Adoption Contact
Open adoption has become more common in adoption in the us statistics since 2015. Today, about 67% of adoptions include some level of openness, ranging from occasional updates to regular visits. This approach offers benefits, such as ongoing connections with birth families, but can also bring challenges related to boundaries and expectations. Most private agency adoptions now encourage open adoption agreements, which can help children maintain their sense of identity and history. These shifts in adoption in the us statistics reflect changing attitudes toward transparency and lifelong connection.
Impact of Societal and Policy Changes
Finally, adoption in the us statistics are shaped by broader societal and policy shifts. Supreme Court decisions, evolving state laws, and social movements have all played roles. The COVID-19 pandemic accelerated innovations like remote home studies and virtual matching events. These changes have made adoption processes more accessible for many families. However, they have also introduced new challenges, such as technology access and privacy concerns. As we look ahead, adoption in the us statistics will continue to reflect the impact of legal, social, and technological change.
State-by-State Breakdown: Regional Adoption Trends
Across the United States, adoption in the us statistics reveal striking differences from state to state. These regional trends showcase not only varying numbers but also unique legal, cultural, and demographic factors influencing adoption experiences.
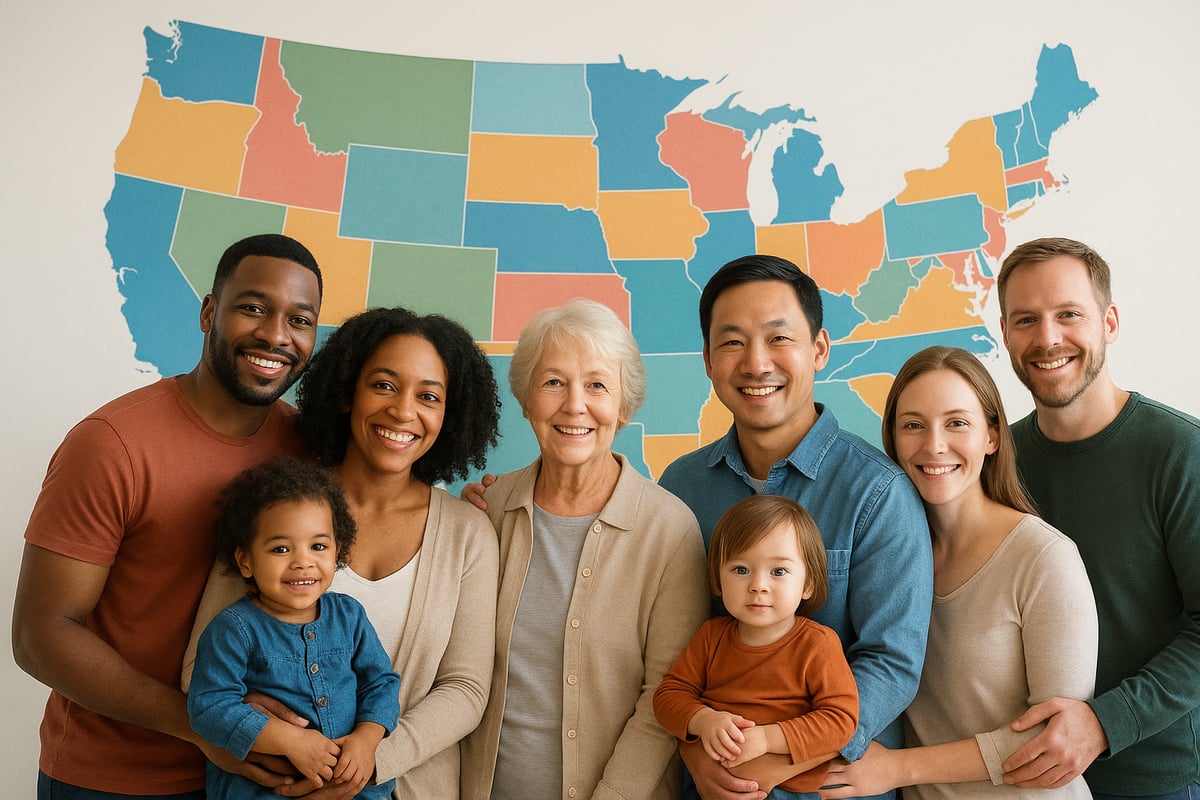
States with the Highest and Lowest Adoption Rates
When examining adoption in the us statistics, it is clear that some states consistently lead in adoption activity. Texas and California, for example, rank at the top for total adoptions, benefiting from larger populations and robust support systems. Conversely, states like Vermont and Hawaii report lower adoption rates per capita, often due to smaller populations and stricter eligibility requirements.
| State | Adoption Rate (per 1,000 children) |
|---|---|
| Texas | 6.2 |
| California | 5.8 |
| Vermont | 2.1 |
| Hawaii | 1.9 |
These variations highlight the importance of local initiatives and policies.
Variations in Adoption Laws and Policies
Adoption in the us statistics are shaped by each state's legal landscape. Differences in consent laws, wait times, and eligibility criteria can dramatically impact adoption experiences. For instance, some states streamline the process for LGBTQ+ parents, while others maintain more restrictive statutes.
- States like California and New York support inclusive adoption rights
- Some Southern states have stricter requirements for unmarried or same-sex couples
- Wait times and consent protocols can differ by several months depending on jurisdiction
Prospective parents should carefully research state-specific laws before beginning the process.
Foster Care System Differences by State
Foster care adoption is a major contributor to adoption in the us statistics, but each state runs its system differently. Michigan, for instance, stands out for its generous adoption subsidy program, providing financial support and post-adoption resources.
Support services may include:
- Monthly subsidies
- Counseling for adoptive families
- Educational grants for adopted children
States with robust foster care systems often see higher adoption rates and better long-term outcomes for children.
Regional Demographic Patterns
Looking at adoption in the us statistics reveals that urban and rural regions display distinct trends. Urban areas, with their greater diversity, report higher rates of transracial and multi-ethnic adoptions. To learn more about these demographic shifts, see Everything About Multi-Ethnic Adoptions.
In contrast, rural states may see more kinship and relative adoptions within close-knit communities. Regional patterns also reflect differences in economic opportunity and cultural openness to adoption.
State Initiatives and Innovations
Innovative state programs are helping to reshape adoption in the us statistics. Florida’s “Explore Adoption” campaign has raised awareness and streamlined the matching process. Other states have piloted partnerships with nonprofits to provide better training and support for adoptive families.
Key initiatives include:
- Online matching systems
- Post-adoption support hotlines
- Public awareness campaigns
These efforts are driving positive change and creating new opportunities for children and families across the country.
Factors Influencing Adoption Rates and Outcomes
Understanding what drives adoption in the US statistics is key for families, policymakers, and advocates who want to make a real impact. Multiple factors interact to shape adoption rates and outcomes. Let’s break down the most influential ones.

Economic and Financial Considerations
Finances play a crucial role in adoption in the US statistics. Many families weigh the significant costs of private, agency, or international adoption, which can range from $20,000 to $50,000. Foster care adoption is often less expensive, but still includes legal fees and home study costs.
Access to financial support, like the federal Adoption Tax Credit and state subsidies, directly affects adoption rates. Economic downturns can reduce the number of families able to pursue adoption. For those seeking help, Financial Assistance for Adoptive Families offers valuable insights on grants, loans, and employer benefits.
Families who understand all available financial resources are better equipped to navigate the process and make informed choices.
Social Attitudes and Cultural Shifts
Public perception is shifting, and this directly influences adoption in the US statistics. Greater visibility of diverse families—single parents, LGBTQ+ couples, and transracial adoptions—has helped reduce stigma and encourage more people to consider adoption.
Media representation and advocacy efforts lead to more open conversations about adoption. As communities embrace openness and inclusivity, more prospective parents feel empowered to adopt, and children of all backgrounds find permanent homes.
These cultural changes are vital for breaking down barriers and driving positive outcomes.
Legal and Policy Changes
Legal frameworks guide every step of the adoption process, impacting adoption in the US statistics over time. Federal laws like the Indian Child Welfare Act (ICWA) protect vulnerable populations, while state laws determine eligibility, consent, and timelines.
Recent updates, such as changes to parental rights termination or more inclusive statutes for LGBTQ+ families, have shaped who can adopt and how quickly. Advocacy groups continue to push for reforms that streamline processes and protect children’s best interests.
Staying informed about legal changes ensures families and professionals can adapt to new requirements.
Role of Technology in Adoption
Technology is transforming adoption in the US statistics by making the process more accessible. Online matching platforms connect families with waiting children faster than ever before. Virtual home studies and digital profiles allow agencies to reach wider audiences, even in rural communities.
Social media also plays a role in connecting birth parents and adoptive families. These tools help streamline paperwork, reduce wait times, and improve transparency.
Embracing technology means more children find families without unnecessary delays.
Barriers to Adoption and Disparities
Despite progress, barriers persist in adoption in the US statistics. Racial, socioeconomic, and geographic disparities limit access for some families and children. Older children, those with disabilities, and children of color often wait longer for adoption.
Common obstacles include high costs, lengthy legal processes, and implicit bias. Addressing these challenges requires targeted policies, better support systems, and ongoing advocacy.
By understanding and tackling these disparities, we can create a more equitable system for everyone.
Projections and Insights for US Adoption in 2026
The landscape of adoption in the US statistics is rapidly shifting as 2026 approaches. Understanding what lies ahead can empower families, advocates, and professionals to make informed decisions. This section breaks down forecasts, innovations, policies, persistent challenges, and expert recommendations for the future of adoption.
More articles
- What Happens at the Hospital When You Place a Baby for Adoption
- Adoption After the Baby Is Born: Rights, Risks, Recovery
- Open vs. Semi-Open Adoption: What Actually Changes
- Financial Help for Pregnant Women Considering Adoption in Indiana
- Choosing an Adoptive Family in Indiana: What to Weigh
- Placing a Baby Up for Adoption in Indiana